General Reporting Anatomy
MetricsFlare.com reporting is designed to help narrow down the focus of the data we are collecting to critical groups of interest. In order for the MetricsFlare.com platform to help you grow and achieve customer success, we need to be able to identify the pain points. Here is the reporting anatomy brief to help you read and use the reporting to your advantage.
This page outlines different sections you can use to identify your pain points and compose an action plan.
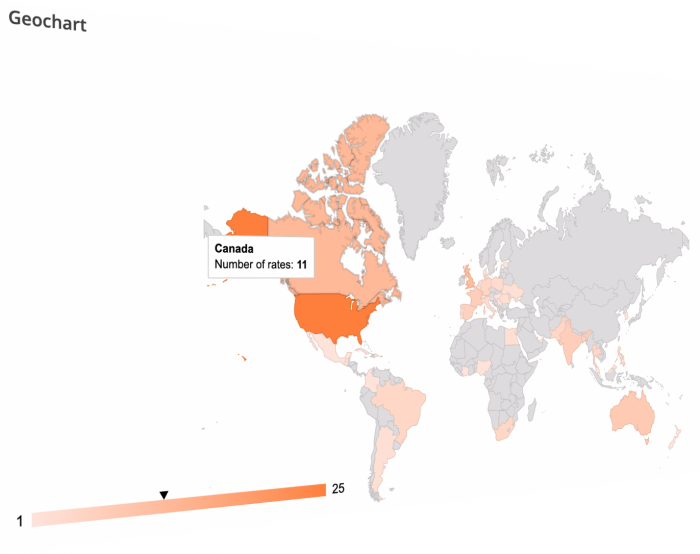
Geo Report
Typically used to geo-identify the most responsive customers. Even if the feedback you get is on the lower segments of the scale in question, you will learn a great deal about how to adapt communication with your customers from different parts of the globe.
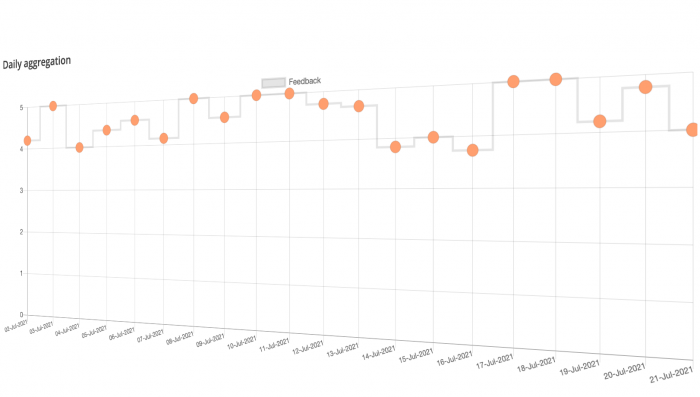
Daily Aggregation
For a wider view of the data we collect sometimes we need to get an average or median of values spread out throughout the longer time frame. In order for us to understand the trends aggregated on daily basis, we’ll use this report.
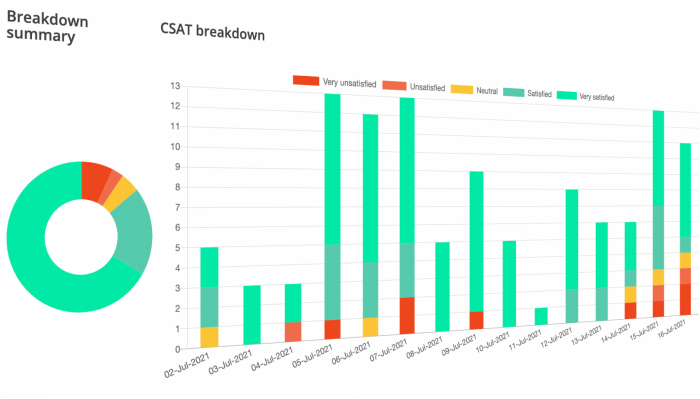
Breakdown
CSAT
Analyze the customer satisfaction score on a segmented view defined by the CSAT scale. Immediate satisfaction we are measuring via CSAT allows us to act quickly on peaks and drops our customers will record by rating satisfactory scores with us. This can only be done by carefully investigating the CSAT breakdown report.
NPS
We all need to measure the pulse of our customers so we know how loyal they are to our brand. Brand loyalty is a coefficient we need to find a way to calculate it and find a way to apply the knowledge from it to improve customer happiness and invoke the customer success that will be rewarded by customer loyalty.
CES
When we want to measure what our customers think how easy it is to work with us we are using this method to break down the feedback on segments so we can understand the feedback better. CES breakdown paints what feedback collected from your customers feel.
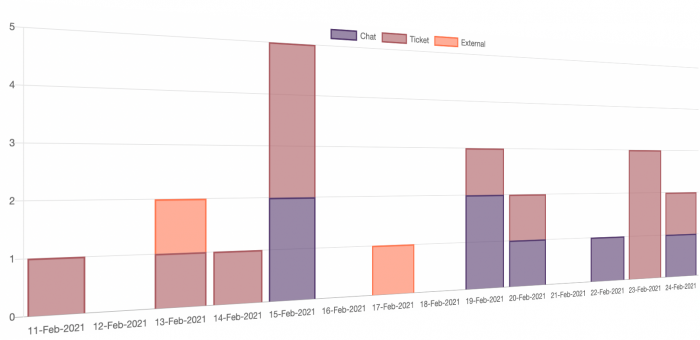
Source Breakdown
For each survey sent out via communication channel, your customer success task force is using to communicate with your clients is resulting in grouped results by the communication channel. We are identifying the two most common communication channels, Ticket, and Chat, and we’ve created a placeholder channel for none of the above, External. The external communication channel is used in special situations you define as not meeting Chat nor Ticket channels, it is not even mandatory to use it, We are using External when we post a survey link on a public location so, results going into the feed are neither from chat nor from ticket/mail. So, this reporting is used when you, for example, want to identify your weakest communication channels.
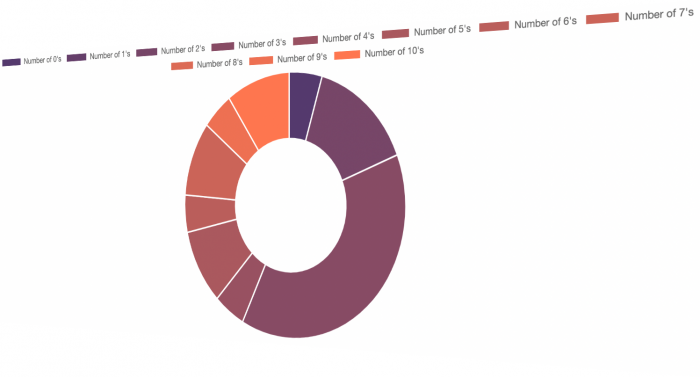
Rates Breakdown
When using the NPS scale to measure your customer loyalty you’ll need to see how the response rates from 0 to 10 are distributed. This report is giving you rates percentage share.
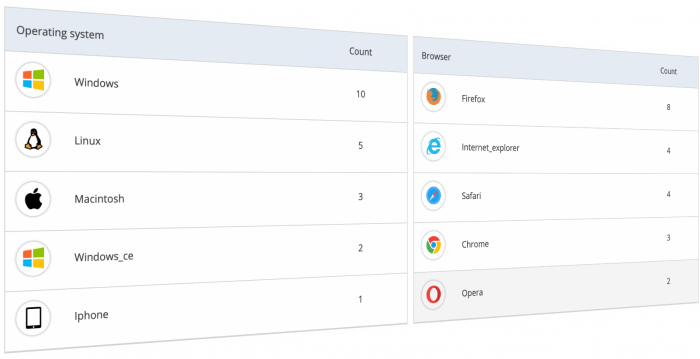
Browser and OS statistics
To have an overview of how your customers are communicating with you this is a good report to take a peek into. It shows responses distribution across different browsers and operating systems. This way is easy to understand the profile of the person you are communicating with and how to adapt your communication.
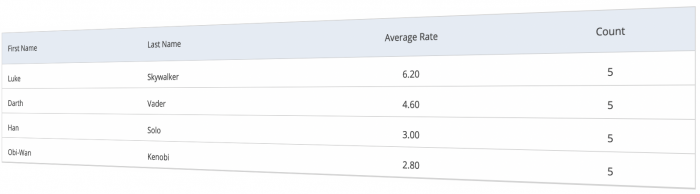
Agents Statistics
One of the most important reports is the agents’ statistics. It gives you direct intel into who are your best performers from the eyes of your customers. It is a unique opportunity to use your customers to give you feedback about your support team. How they feel about communicating with your team.